Please click on the data visualizations inside the TV screen (and wait for the animation).
 |
 |
 |
 |
 |
 |
 |
 |
 |
A picture is worth a thousand words!
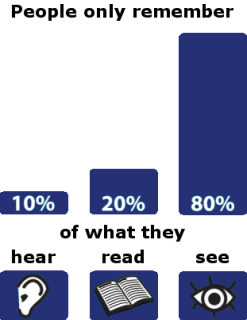

To take a decision, your brain uses 10% of what it heard, 20% of what it read and 80% of what it saw. To make an effective decision, scientists tell us that it is more efficient to send the information to your brain as visually as possible. This is what BeGraphic does by bringing better visualization for your reports and presentations.
Because data visualization is more powerful with meaningful images (rather than the over-used pie chart), BeGraphic handles the parameters of your specific picture as if it was an Excel chart. BeGraphic allows you to change the color, border of any object shown on Microsoft Excel or PowerPoint. But it can also move or make disappear your specific logos and icons on any background (e.g.: custom map, podium showing best products).
Therefore you are able to design any type of innovative chart, build your custom maps, and create your own story-telling presentation, such as the infographics you read in newspapers.
Which charts can be built with BeGraphic?
Almost any type of charts, graph templates and data visualization (graphical representations) can be done in Excel or PowerPoint (all versions from Microsoft Office 2000 to Microsoft Office 2010 - 64 bits) with BeGraphic:
- Innovative charts: cascade chart / waterfall chart, Marimekko / Mekko chart, Bumpchart, Parallel coordinates, Cleveland dot plot, Tree map, PowerPivot charts, Pivot chart
- Data-graphic diagrams: Ishikawa / cause-effect diagram, dynamic diagram, Pivot diagram, SCADA system, control room, strategic maps, Balanced Scorecard stratgy map
- Tufte's in-cell charts: mini-graphs, micro-charts, sparklines for Excel
- All-inclusive charts: commented charts, augmented graphics
- Data-driven matrix: SWOT analysis model, vector glyph, BCG matrix, ALD matrix, McKinsey matrix 7S, RB profiler
- Dynamic maps: Choropleth map, make a custom map in Excel, thematic map in PowerPoint, dynamic sales territory, mapping tool, geographical information system in Excel 2010, and any innovative charts
- Story-telling graphics: DuPont chart, business chart, business graphics, professional excel chart, Excel gauges, professional-looking dashboard visualizations, moving bubble, motion chart, trend analyzer...
Which databases / query makers can be connected to BeGraphic?
You can choose to store your data either in Excel or in databases linked to the spreadsheet
by a read-write plugin such as:
- Olap databases: Microsoft PowerPivot, IBM Cognos Applix TM1, Hyperion Essbase, Microsot Analysis Services, Microsoft SQL Server, MIS Alea (Infor), Jedox PALO Open Source OLAP, SAP Business Information Warehouse
- Excel Connectivity Add-ins, Excel add-on for query: Cognos TM1 (Applix), Comshare MPC (Infor), Crystal Analysis Excel add-in (Business Objects), Oracle Essbase Spreadsheet Add-in (Hyperion), Hyperion Smart View, IntelligentApps, Microsoft Excel PivotTable, Microsoft Add-in for SQL Server Analysis, Microsoft PerformancePoint, Microsoft PowerPivot, MIS Alea (Infor), MIS Plain (Infor), SAP BPC OutlookSoft, PALO Open Source OLAP, Panorama NovaView Add-in, SAP Business Explorer Analyzer, XlCubed, Bristol Decision (Bristol Report), Dodeca (Applied Olap)
- Reporting tools: Busines Objects Live Office, vision XL F9, Business Intelligence Inc Datalink Query (Bidata), Myreport (Report One), Starquery (Symtrax)
- MDX Provider XMLA (Simba), Abas software, Sybase aleri, Alterian, Attaché (Attache Software), Descisys, Interflex, Panoration, FastObjects (Poet), CodeBase (Sequiter), Unify Corporation (Unify), Conzept 16 (Vectorsoft)
- Please ask for compatibility with web, flash or silverlight tools, such as Sharepoint Excel Services, PerformancePoint, Visio, Expression, MapPoint, Xcelsius, Qlikview, Dundas, OBIee, Tableau Software, Hyperion Visual explorer, Illustrator, Autocad, Tibco Sportfire, SAS Jmp, Fusioncharts, Componentone, Visualmining, Corda, Softwarefx, Visifire, Anychart, Dotnetcharting, Panopticon, Maani, Arcplan Entreprise (Dynasight), Executive viewer, Clarity 6 (Clarity systems), Reporting Services, Reportnet, SAP Voyager / Pioneer.
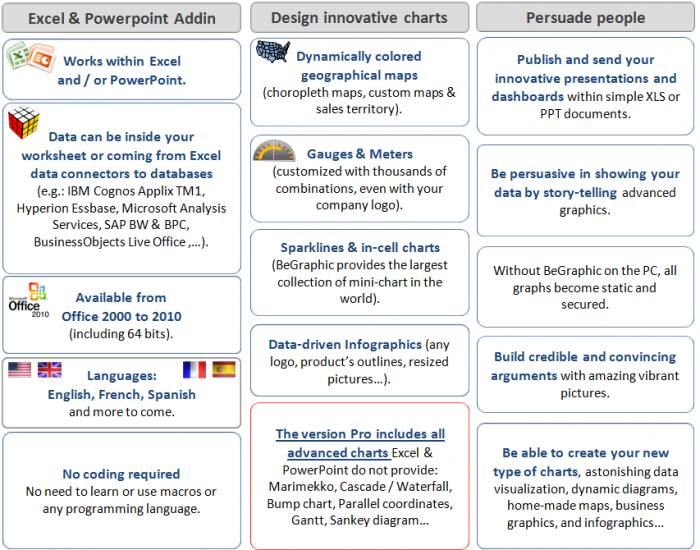
Excel & PowerPoint Adddin: Works within Excel and / or PowerPoint. Data can be inside your worksheet or coming from Excel data connectors to databases (e.g.: IBM Cognos Applix TM1, Hyperion Essbase, Microsoft Analysis Services, SAP BW & BPC, BusinessObjects Live Office,...). Available from Office 2000 to 2010 (including 64 bits). Languages: English, French, Spanish and more to come. No coding required: no need to learn or use macros or any programming language.
Design innovative charts : dynamically colored geographical maps (choropleth maps, custom maps & sales territory). Gauges & meters (customized with thousands of combinations, even with your company logo). Sparklines & in-cell charts (BeGraphic provides the largest collection of mini-chart in the world). Data-driven infographics (any logo, product's outlines, resized pictured...). The version Pro includes all advanced charts Excel & PowerPoint do not provide: Marimekko, Cascade / Waterfall, BumpChart, Parallel coordinates, Gantt, Sanley diagram...
Persuade people: publish and send your innovative presentations and dashboards within simple XLS or PPT documents. Be persuasive in showing your data by story-telling advances graphics. Without BeGraphic on the PC, all graphs become static and secured. Build credible and convincing arguments with amazing vibrant pictures. Be able to create your new type of charts, astonishing data visualization, dynamic diagrams, home-made maps, business graphics and infographics...
Data visualization, gift, maps, cartes, free maps, dynamically colored geographical maps, the largest collection of maps, geographical maps, interactive maps, data-driven maps, maps in PowerPoint, maps in Excel, Ms Office maps, WMF format, cliparts maps, data-driven diagram, story-telling, innovative charts.
18 types of sparklines: bullet chart, line chart, area chart, horizon chart, hbar chart, barchart, bar chart, Varichart, cascade, stacked chart, Pieflat, Pareto chart, BoxPlot, Stripes chart, Spreadchart, Heatmap and scales.
With this Excel add-in you will be able to: Copy and paste format from a chart to another, complex data-driven charts directly from Excel data, transforms your data charts into enjoyable and captivating communication. Data charts don't have to be plain and austere, they can be interactive experiences with attractive visuals, animationis an add-in for Microsoft Office that lets you create your own spark lines in Excel, Word, PowerPoint, and HTML documents, PowerPoint plug-in for data visualization, Data charts don't have to be plain and austere, they can be interactive experiences with attractive visuals, animation, easy-to-use software for creating business charts and diagrams, Accounting Software, Business Drawing Software, Certificate Creating Software, CAD Drawing Software, Floor Plan Software & Flowchart Software, attractive graphs excel, BeGraphic builds Wow Chart as the quick way to get spectacular animated bar charts in PowerPoint or Excel. Wow Chart made by BeGraphic produces awesome charts, for better impact, So you can make flashy chart with attractive animation effects and based on excel data, easily creating and maintaining org charts using Word, Excel, ... you to create animated, compact, interactive and attractive chartshigh end PPT presentations suitable for a very senior / executive audience, presentations to be enhanced, professional boardroom presentation, create graphic elements with shapes, add or edit the text on the shape elements in all SmartArt graphics by using these procedures, info-graphic elements like diagrams, charts, and maps show relationships, easy it is to create graphic elements with shapes in Photoshop, Select the element (shape, drawing, line), Element and Drawing tabs place elements like images, complex data-driven graphics from Excel datatext labels and shapes, By combining shapes, pictures, and hyperlinks, A visually rich presentation scores so much higher than one that contain just text. PowerPoint plug-in for data graphics, Info-graphic elements like diagrams, charts, and maps show relationships, figures, and locations -- and contain text as part of the graphic too, Visio 2007, Drag and drop the stencil shapes from the Shapes pane on the left side to start creating your drawing, Although PowerPoint and other Microsoft Office applications include many info-graphic options,