(The best hidden secret in Data visualization)
Would you trust a shortsighted doctor that knows only two pills? Of course not!
Well, most data visualization experts(*) give advices about the best graphics among the 72 charts included in Excel… without seeing that these 72 are only variants of two basic ones : univariate (on rail) and bivariate (XY plane).
.
I Charts on rail
Do you know what is an Equalizer? It’s a table full of rail-mounted buttons. Well 84% of Excel charts are variants of this fundamental data visualization. Let me explain it to you
1. First we have to select the button’s shape
You can choose to visualize
· only the position to show (dot plot)
· or the entire column (e.g.: column, 3-D column, cylinder, cone, pyramid…)
2. Then we must choose the type of rail
The rail can be made of
· parallel lines : vertical (column), horizontal (bar)
· several radiant lines(radar), centered from a single point
· half-circular (gauge, speedo-meter, odometer), highlighted by the needle
· circular (pie chart, doughnut), emphasized by the colored slice
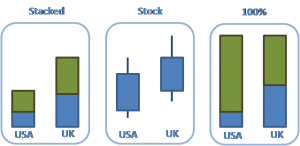
3.Last, we can add some options, mainly two.
· several data on the same rail :
o from the basis (stacked column), usually from “zero”
o from another position (e.g.: stock charts, Japanese candlestick, box and whisker, Gantt, Cascade/Waterfall)
· 100%, to put all columns in percentage.
.
II Charts on XY plane
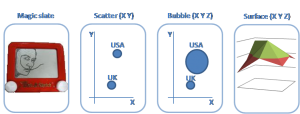
Do you remember playing with a magic slate? You only had to turn the buttons in each corner to draw your work of art, and then simply shake the board upside down to start again. Well 16% of Excel charts are variants of this fundamental data visualization. Let me explain it to you .
1. First we have to select the scales on the two axis (X and Y, also called abscissa and ordinate).
2. Then you plot data points
Each point has its
· two coordinates, making a complete chart (scatter)
· sometimes even three coordinates (this sub-category includes X, Y + Z), by making a 3-D data visualization (Surface) or a “Bubble chart” where the third dimension “Z” is represented by the bubbles’ size.
3. Last, we can add some options, mainly three.
· adding a line between points (Line chart, Gapminder with trace)
· under the line, highlight the area with a colored place (Area chart)
· Matrix (BCG matrix, ADL matrix, Magic Quadrant, contextual area)
.
Conclusion:
The following questions are:
· How many other data visualizations exist?
· Are there some smarter ones? (Answer is Yes. During next 12 months, BeGraphic will bring two truly innovative graphics).
· How can we add them inside Excel and PowerPoint (The popular business tools)?
This will be explained in a coming article that BeGraphic’s team has to finish. But right now by installing BeGraphic on your computer, you can add custom charting capabilities to Excel and PowerPoint.
.
*: The tiny world of self-claimed international experts is made of IT bloggers or self-published writers. Only the smarter made a non official “advertisement exchange” deal with chosen journalists.
So do serious data visualization scientists exist? Yes, European cartographers, who make maps for ages! Because during centuries, their question has been about how to densify information on paper, without being chaotic (fashionable people would speak about “Data-pixel ratio” and ergonomics). Are they famous? May be one: Jacques Bertin (born during the First World War, and still writing… “Mes respects à ce grand Monsieur”). I’d be curious to know how many of these so-called “experts” have entirely read his books before giving their opinion.


